One of Microsoft’s recent blog posts asks a good question: “We already use Datadog (or Prometheus, etc.). Why switch just because we added Azure OpenAI?”
The short answer: you don’t have to. Microsoft is making it possible to monitor Azure OpenAI with your existing observability tools — but with caveats, trade-offs, and setup work. Let’s dig in.
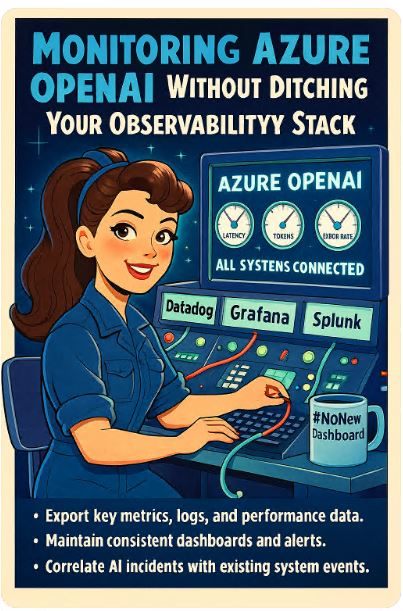
What Microsoft Proposes: Hybrid Observability
Microsoft’s model is: don’t force you to rip out what already works. Instead, they provide APIs, metrics, logs from OpenAI, and let you pull them into your observability platform of choice (Datadog, New Relic, Splunk, etc.).
Some components:
-
Log Analytics / Azure Monitor support for OpenAI (via Azure AI Foundry) as a baseline.
-
Export hooks / ingestion so that rate limits, token usage, latency, error codes, and usage metrics can be shipped to your existing dashboards.
-
Bridging the gap: you don’t lose context (correlations) when you bring OpenAI observability into your system.
In short: Microsoft is offering “observability as a bridge”, not a hard lock into Azure Monitor.
Why This Approach Matters
This isn’t just nice — it’s critical for organizations that:
-
Already invested heavily in observability tooling (and aren’t about to rip it out).
-
Need consistent dashboards across all services (AI + non-AI).
-
Care about correlation: linking AI behavior to other system events (network, storage, DB, etc.).
-
Want to avoid the “shadow AI stack” problem: where OpenAI becomes a black box nobody watches except when it misbehaves.
Let’s be blunt: if you force a separate “AI observability silo,” you lose context, alerts get disjointed, and debugging becomes a headache.
What You’ll Need to Do (Because Nothing’s Free)
This bridging doesn’t happen by magic. Be ready for:
-
Discover metrics / logs in Azure / Foundry
Find what’s exposed: usage, latency, error codes, throttling, queue depth, etc. -
Map them to your observability schema
Your dashboards already expect certain field names, tags, dimensions. You’ll need to adapt. -
Set up data pipelines / exporters
Use Azure Monitor’s “export to Event Hub / Log Analytics / metrics export” or agent-based ingestion. -
Alerting / anomaly detection
Define thresholds, baselines. AI workloads have bursty patterns; naive thresholds will produce noise. -
Correlation & context linking
When OpenAI gets a timeout or error, correlate with CPU, memory, network, DB queries — ideally on the same timeline. -
Ensure cost visibility & limits
Because once you start exporting a flood of telemetry, ingestion / retention costs can surprise you. -
Trust but verify
Don’t trust that every OpenAI metric will be perfect. Add data validation, checksums, and resiliency in your pipelines.
Caveats, Risks & What You Lose
-
Latency / sampling differences
Azure’s internal metrics might have different timing or sampling than your “in-house” metrics. That can cause mismatch in dashboards. -
Missing deep internal telemetry
Some low-level internal traces or internal AI infrastructure events may never be exposed outward. You’ll still be blind in some edge cases. -
Complex setup & mapping effort
Bridging observability is effort — schema mapping, pipeline setup, tag hygiene. This is nontrivial. -
Cost & storage overhead
High-volume AI workloads = lots of telemetry. Exporting everything can blow ingestion / storage budgets fast. -
Drift or changes in Microsoft’s API surface
If Microsoft changes how OpenAI or Foundry exposes metrics / logs, your bridging logic might break.
My Take
I like this approach. It shows Microsoft understands that observability is a “cross-cutting concern,” not a feature you bolt on. Letting customers keep their existing stacks while integrating AI metrics is smart.
But it’s not effortless. The hardest part is schema & context alignment: making sure your AI metrics live in the same mental model as your database, networking, compute, and user-side metrics.
If I were advising you: start small. Pick 3–5 AI metrics you care about (latency, error rate, token count). Bring them into your observability platform. Correlate with system metrics. Validate. Then broaden.